Predictive maintenance software for a water utility's pump stations
Pump failures at lift stations mean night call-outs, bypass pumping and overflow risk. This is how we'd build predictive maintenance software that watches SCADA and vibration data, ranks pump risk with the evidence, and lets planners fix pumps before they fail.
Industry
Water and wastewater utilities
Typical timeline
12–14 weeks
Typical team
5 people

The situation
Picture a regional water and wastewater utility serving about 400,000 people. It runs 120 pump stations: booster stations that keep water pressure up in hilly districts, and lift stations that move wastewater toward the treatment plant. Between them there are 264 pumps, most of them between 15 and 150 horsepower.
Maintenance is a mix of calendar visits and run-to-failure. Crews check each station on a fixed schedule whether it needs it or not, and pumps that fail between visits become emergency call-outs, often at night or during storms, when lift stations are working hardest. A failed lift station pump can mean bypass pumping, overtime and, at worst, a sewer overflow the utility has to report.
The data to spot trouble early already exists. The SCADA historian has years of flow, pressure, motor current, run hours and wet-well levels. The maintenance system has every past work order. Nobody has the time to look at both together for 264 pumps. The utility wants predictive maintenance software that does that watching, and tells planners which pumps need attention, and why.
Signs this blueprint fits you
- You run dozens or hundreds of pumps, motors or similar rotating equipment.
- Maintenance is mostly calendar-based, and failures still happen between visits.
- You have a SCADA historian or other sensor data that nobody reviews pump by pump.
- Your maintenance system holds years of work orders with failure notes.
- Emergency call-outs and overtime are a large share of your maintenance budget.
What we'd build
- A data pipeline that pulls readings from the SCADA historian every few minutes, cleans gaps and sensor faults, and lines them up with each pump's maintenance history.
- Vibration sensors on critical pumps. Wireless sensors on the largest lift station pumps, where SCADA data alone can't see bearing and alignment problems.
- Machine learning models for each pump type that learn normal behaviour for each pump and flag changes: rising vibration, higher current for the same flow, more starts per hour, falling pressure.
- A risk ranking across every station, with the signals behind each risk and similar past failures from the work order history.
- A planner screen where maintenance planners review alerts, accept or dismiss them, and record what crews find.
- A maintenance system link that creates work orders in Maximo, Cityworks or similar when a planner accepts an alert.
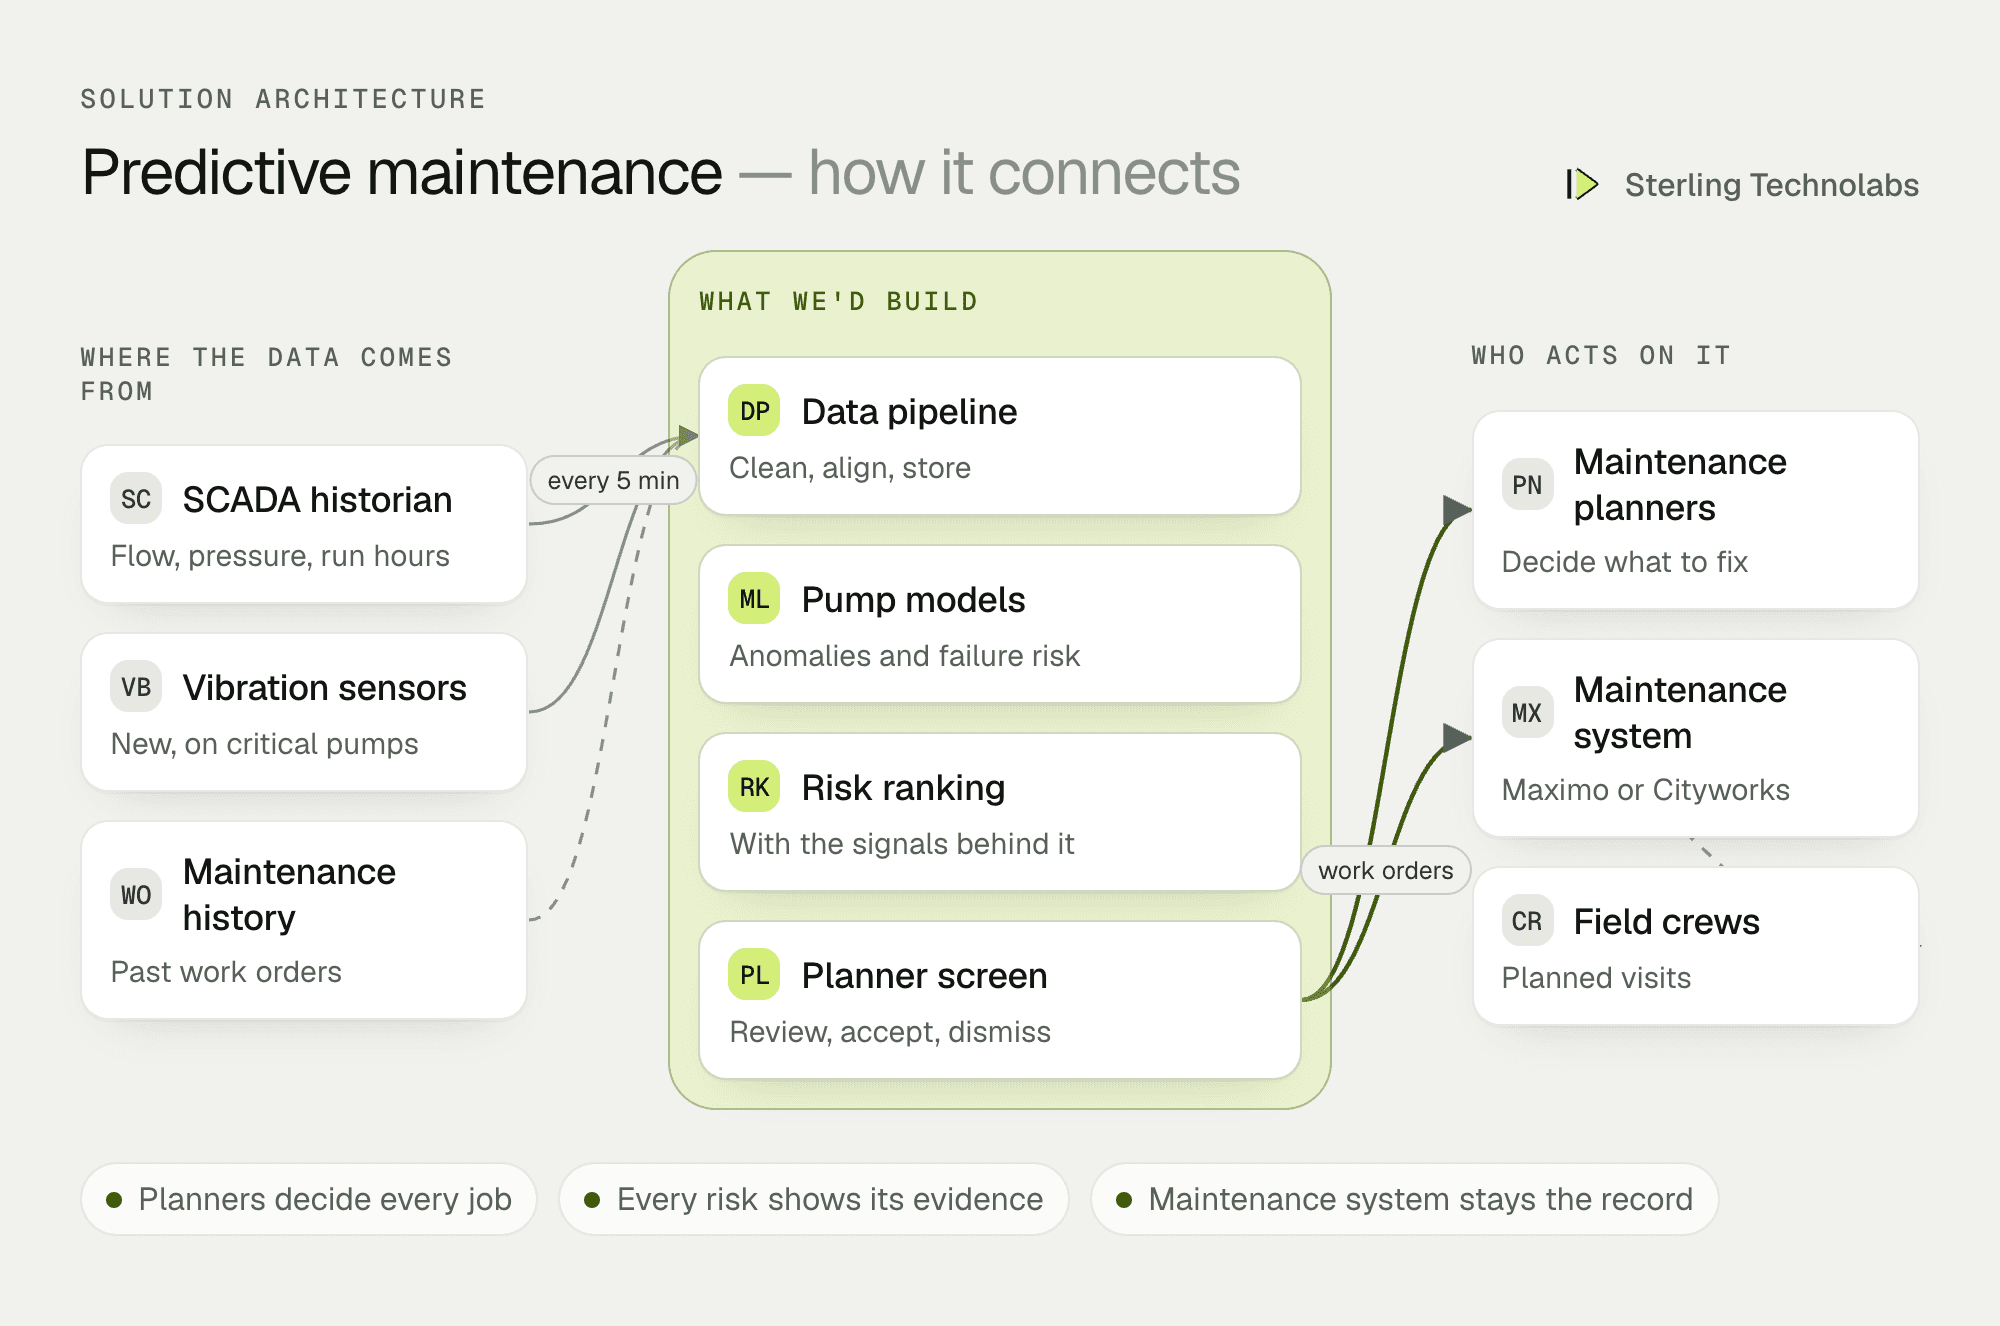
How the pieces fit
Start with the data you already have
Most of the signal is already in the historian. Motor current against flow shows a pump that is working harder than it should. Starts per hour and run time show a wet well or control problem. Pressure at a booster station shows impeller wear. We'd start by checking data quality for every pump, because a model is only as good as the readings behind it, and fix tag naming and gaps before building anything.
Add sensors where the risk is highest
Bearing and alignment problems show up in vibration weeks before they show up anywhere else. Wiring vibration monitoring into 264 pumps would be expensive, so we'd fit wireless sensors to the 40 or so pumps where a failure costs the most: large lift stations, stations with a single duty pump, and stations near sensitive areas.
Models that explain themselves
Predictive maintenance with machine learning only works if planners trust it. Each alert shows the signals that moved, a chart of the trend, and past work orders on similar pumps where the same pattern ended in a failure. We'd start with simple anomaly detection per pump and add failure-risk models for pump types with enough failure history to learn from. Every accepted or dismissed alert, and every crew finding, goes back into the next round of training.
Planners stay in charge
The software never sends a crew on its own. It ranks risks and drafts the work order; a planner decides whether, when and how to act. Calendar maintenance continues during the pilot, so nothing is skipped while the utility learns how far to trust the alerts.
One pump, end to end
Here is a wastewater lift station pump with a bearing starting to wear.
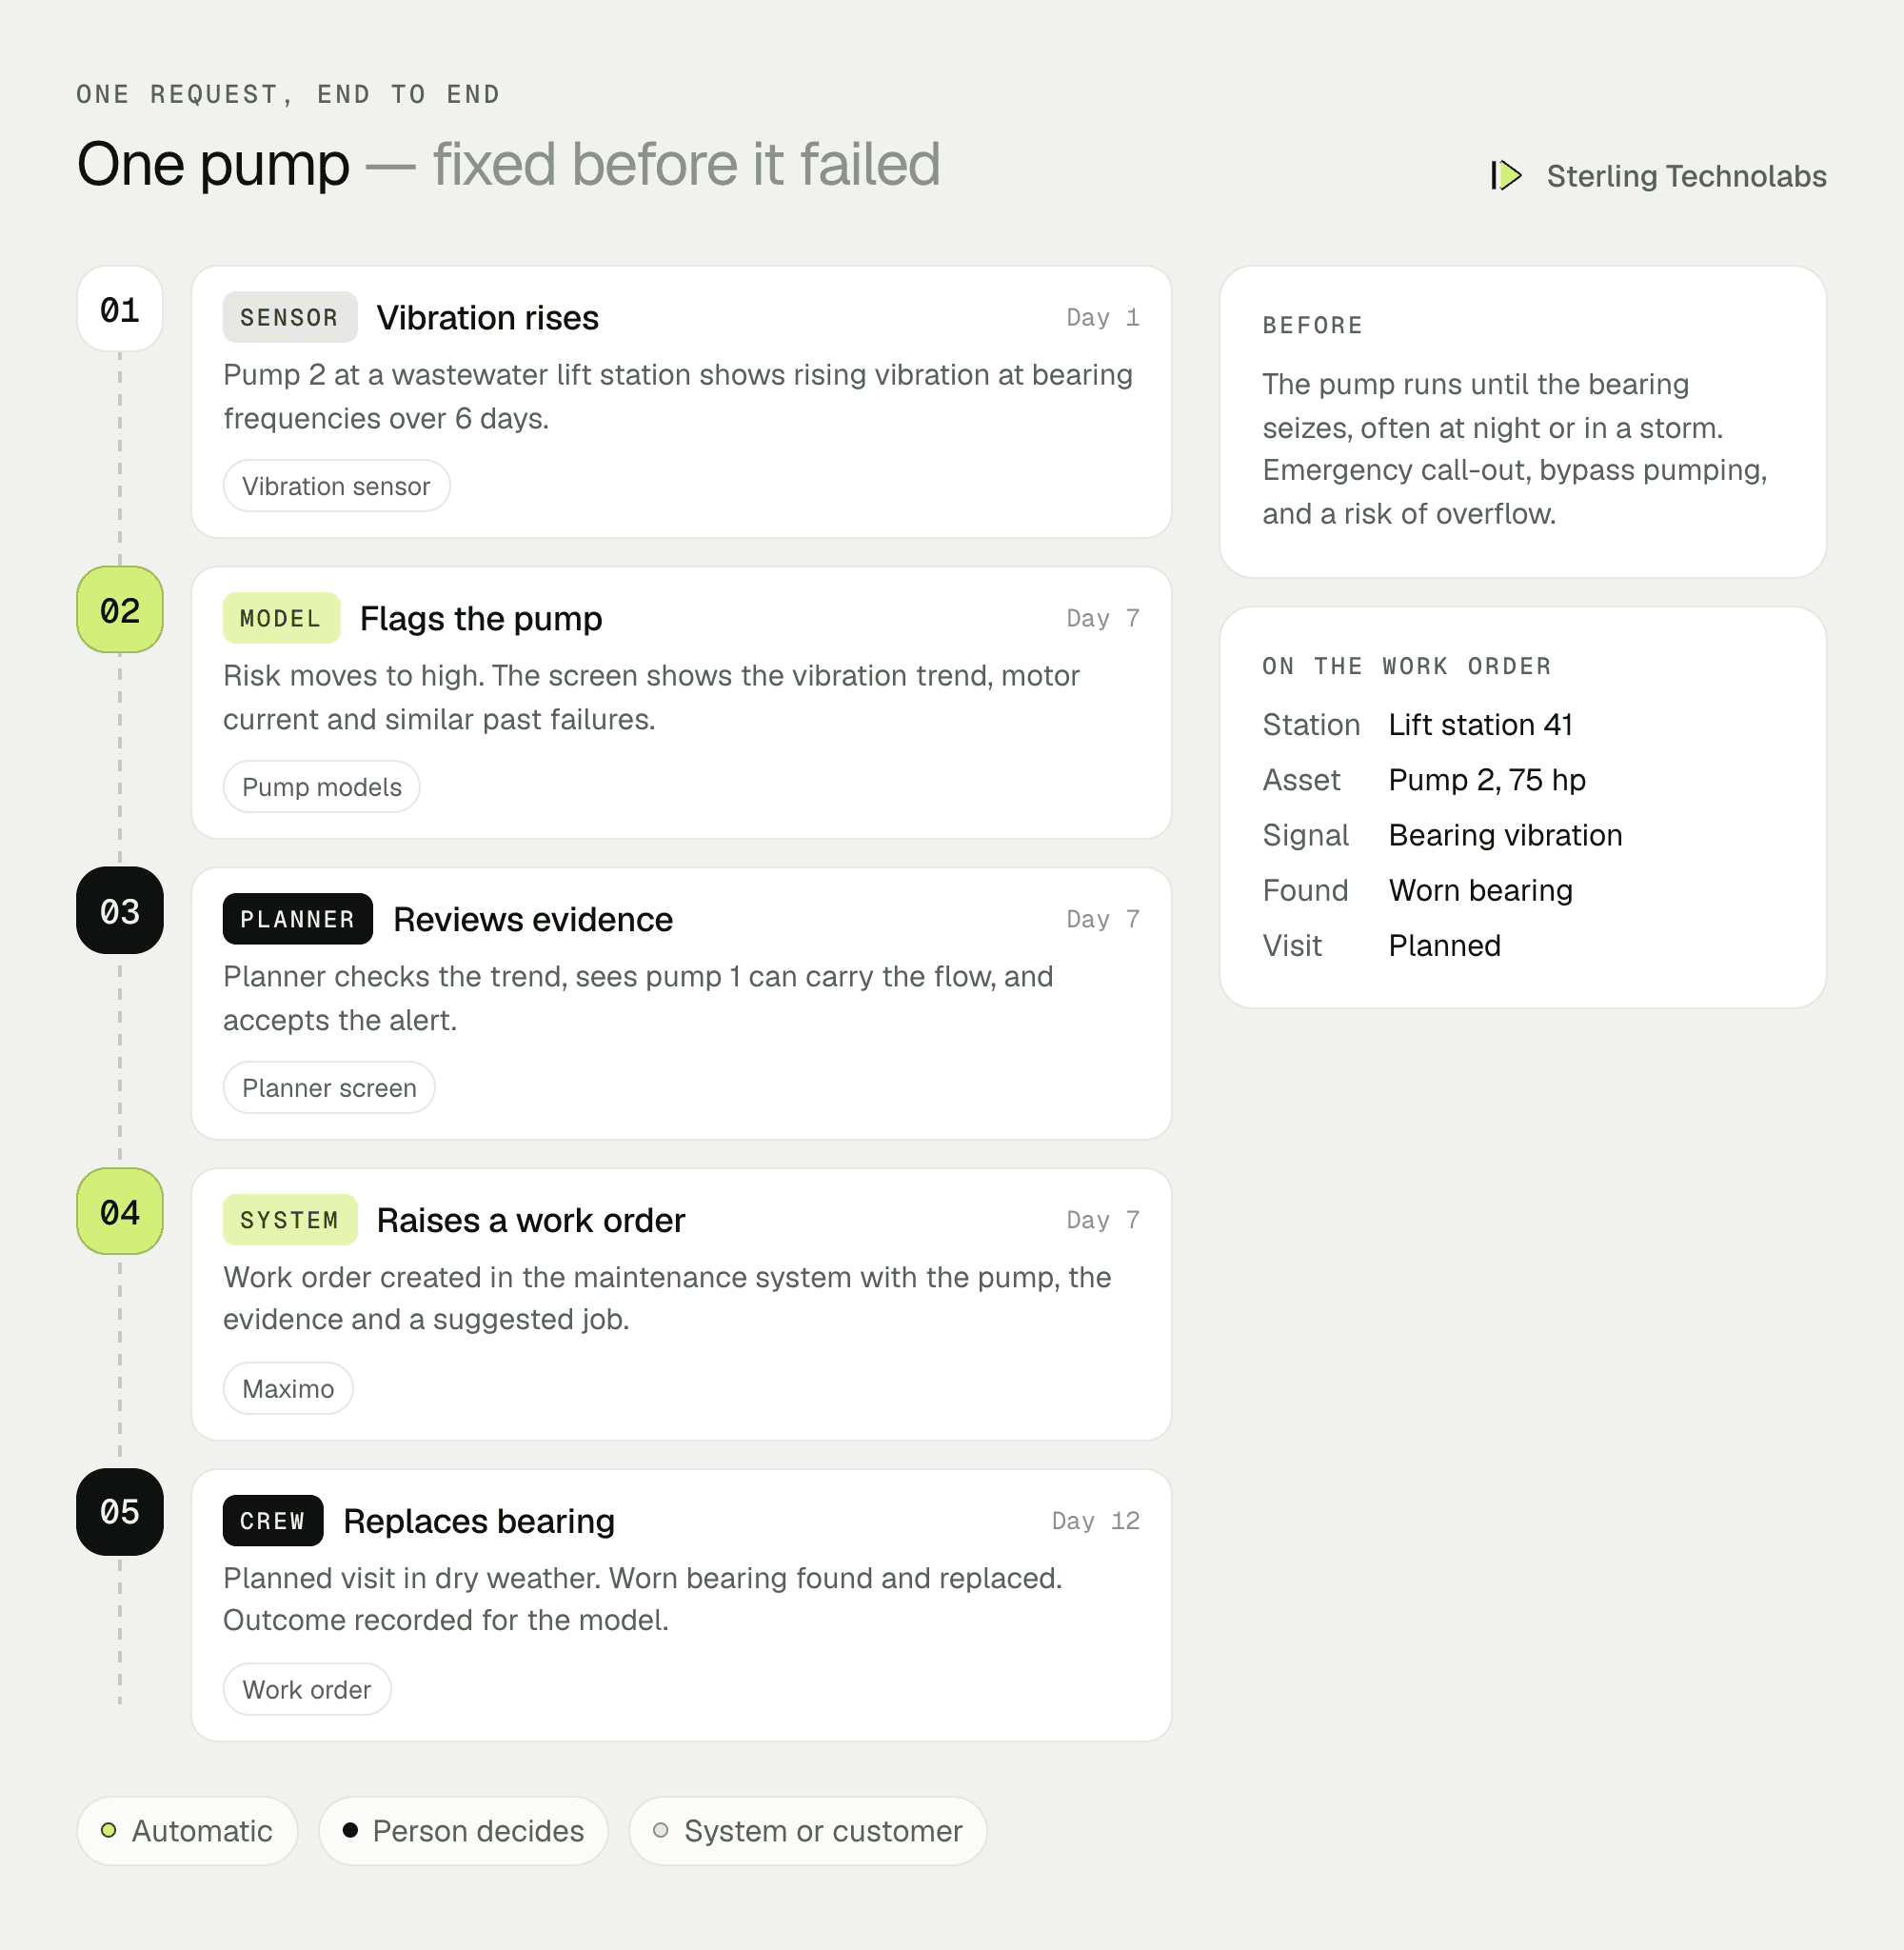
The bearing was replaced on a dry-weather weekday instead of failing during a storm, and the finding went back into the model.
What planners would see
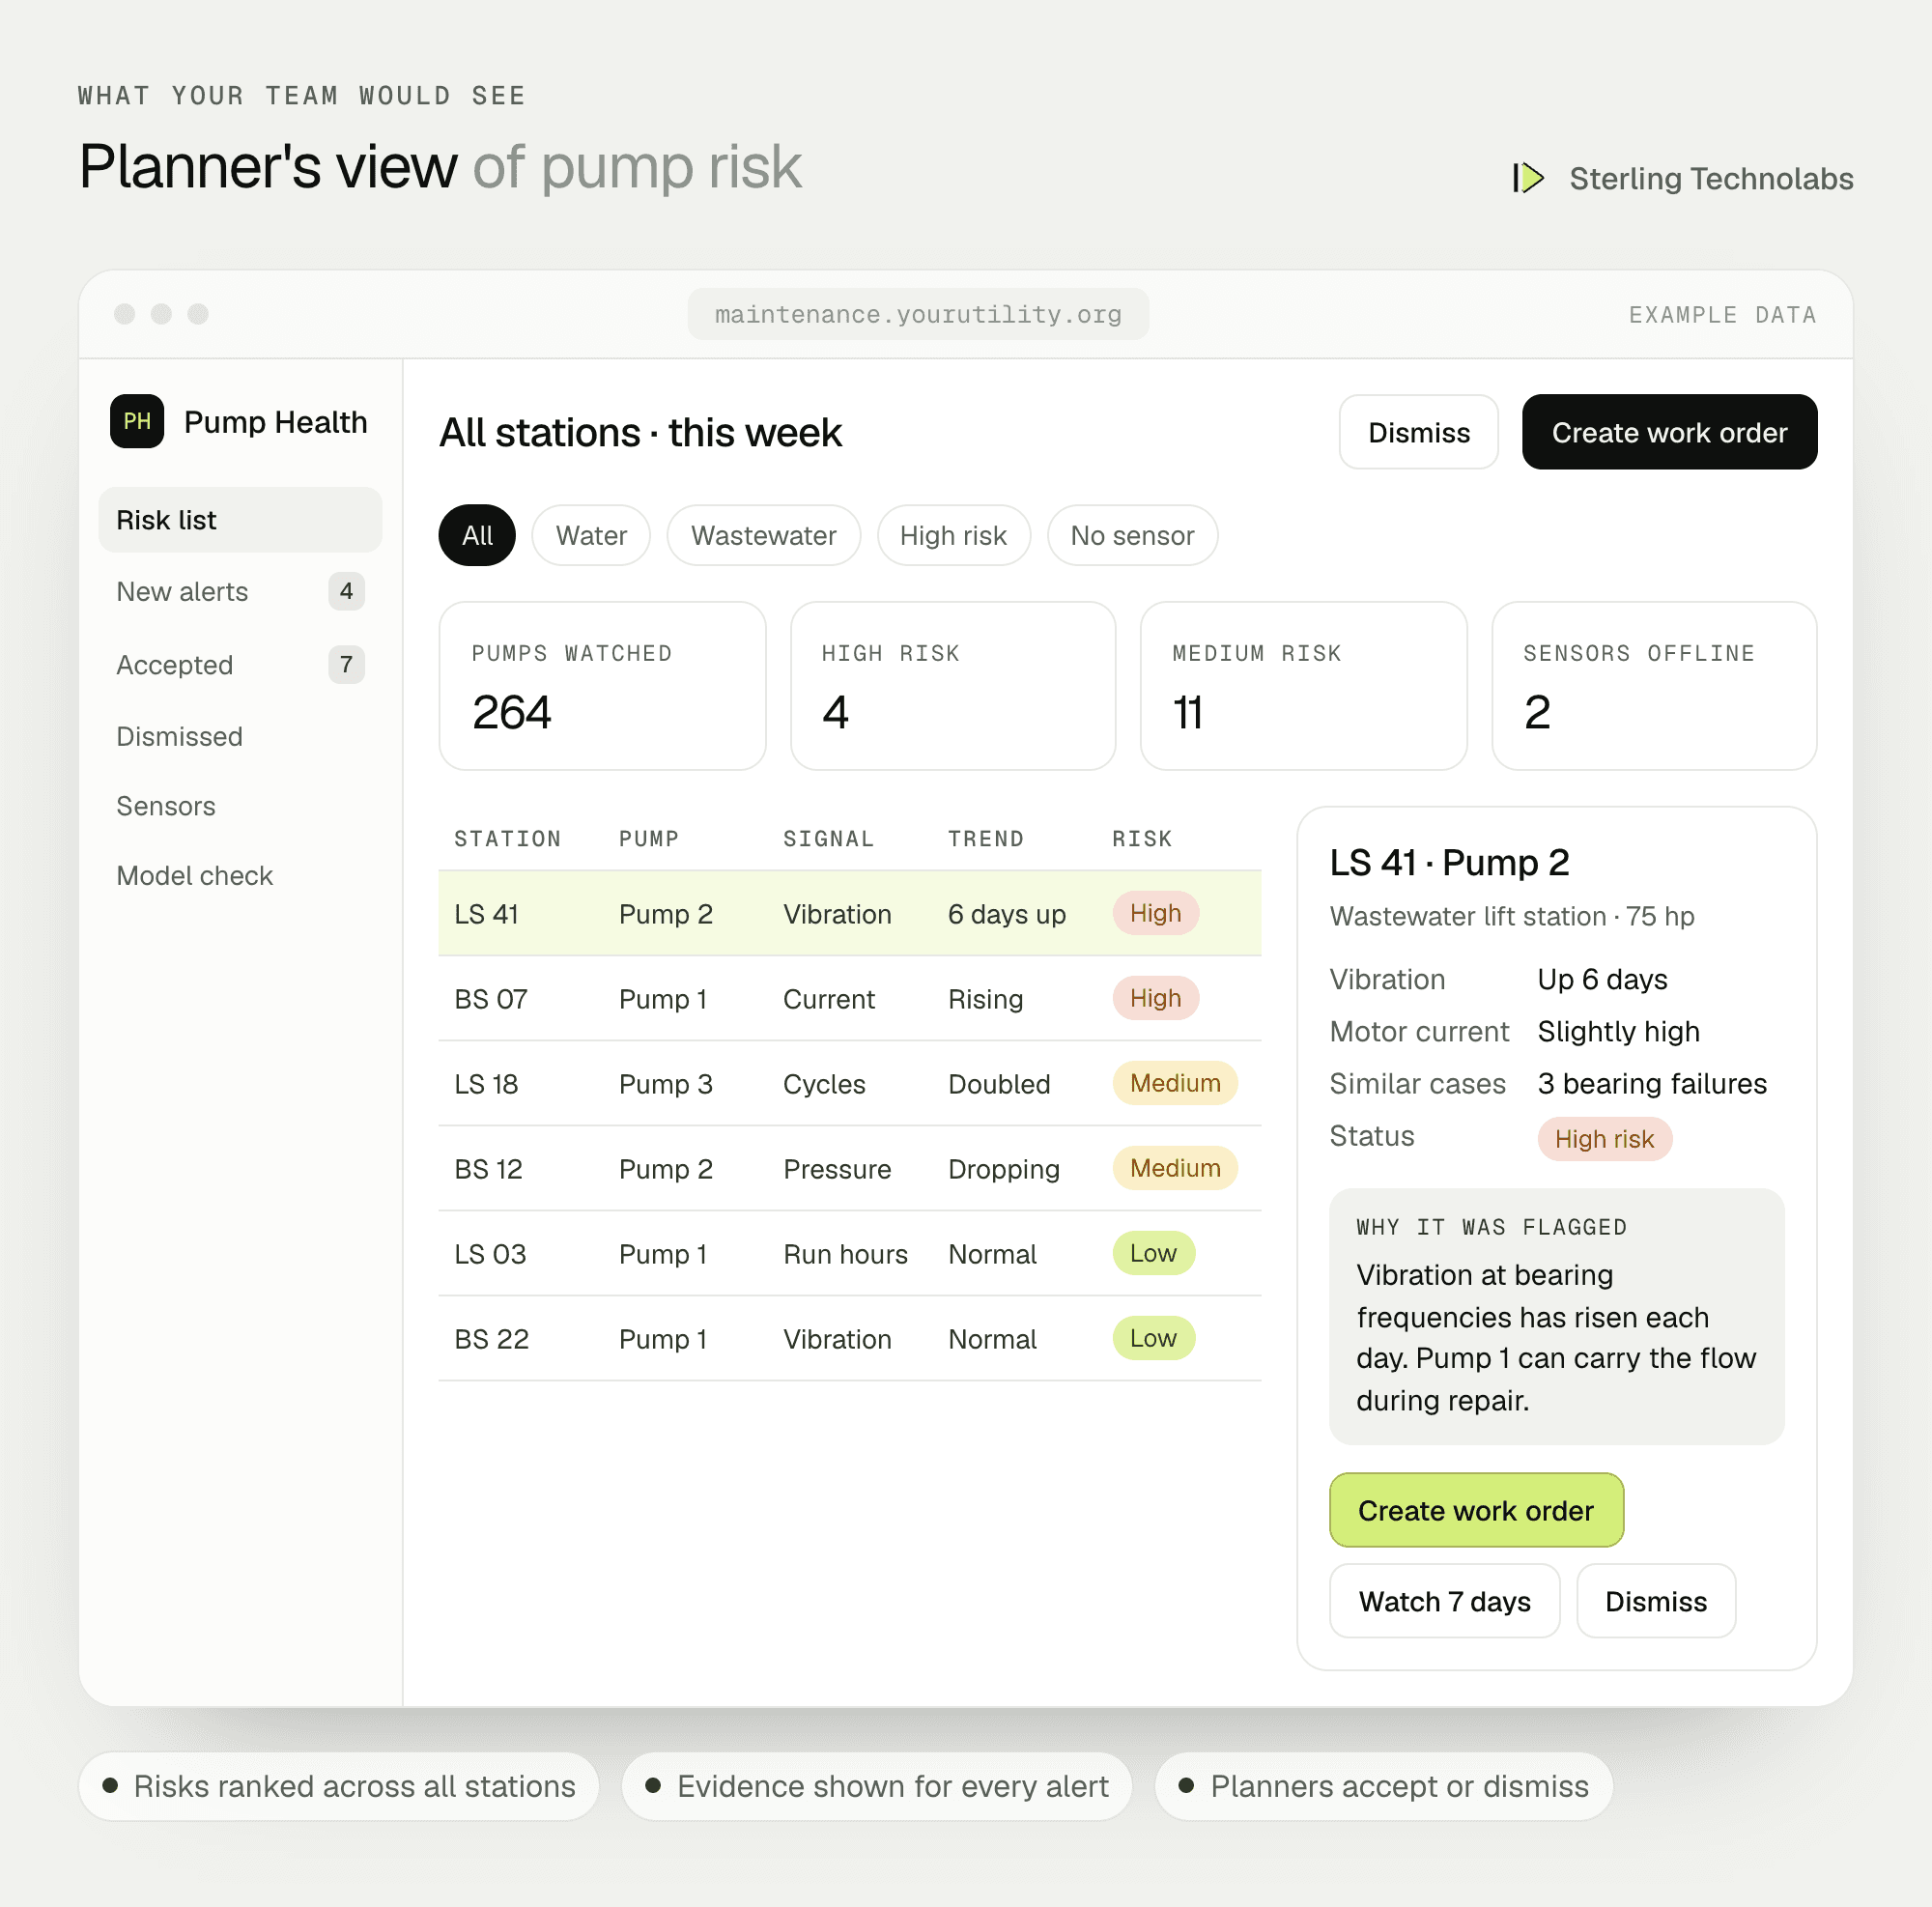
Planners see every pump ranked by risk, with the signal and trend behind each one. Opening an alert shows the charts, similar past failures and whether another pump can carry the flow during a repair.
Predictive maintenance features by role
| Maintenance planners | Operations managers | Field crews |
|---|---|---|
| Risk list across all stations | Station and pump health overview | Work orders with the evidence attached |
| Alerts with charts and similar cases | Emergency call-outs over time | Pump history in one place |
| Accept, watch or dismiss | Sensor and data health | Findings recorded after each visit |
| Work orders drafted for review | Model accuracy each month | Planned visits instead of call-outs |
Data and integrations
| Data | Source | Direction | How often |
|---|---|---|---|
| Flow, pressure, current, run hours, levels | SCADA historian (AVEVA PI or similar) | To the pipeline | Every 5 minutes |
| Vibration and temperature | Wireless sensors on critical pumps | To the pipeline | Every few minutes |
| Assets and past work orders | Maintenance system (Maximo, Cityworks) | To the pipeline | Nightly |
| New work orders | Planner screen | To the maintenance system | When a planner accepts |
| Crew findings | Maintenance system | Back to the models | Nightly |
| Rainfall forecast (optional) | Weather service | To the risk ranking | Hourly |
Delivery plan
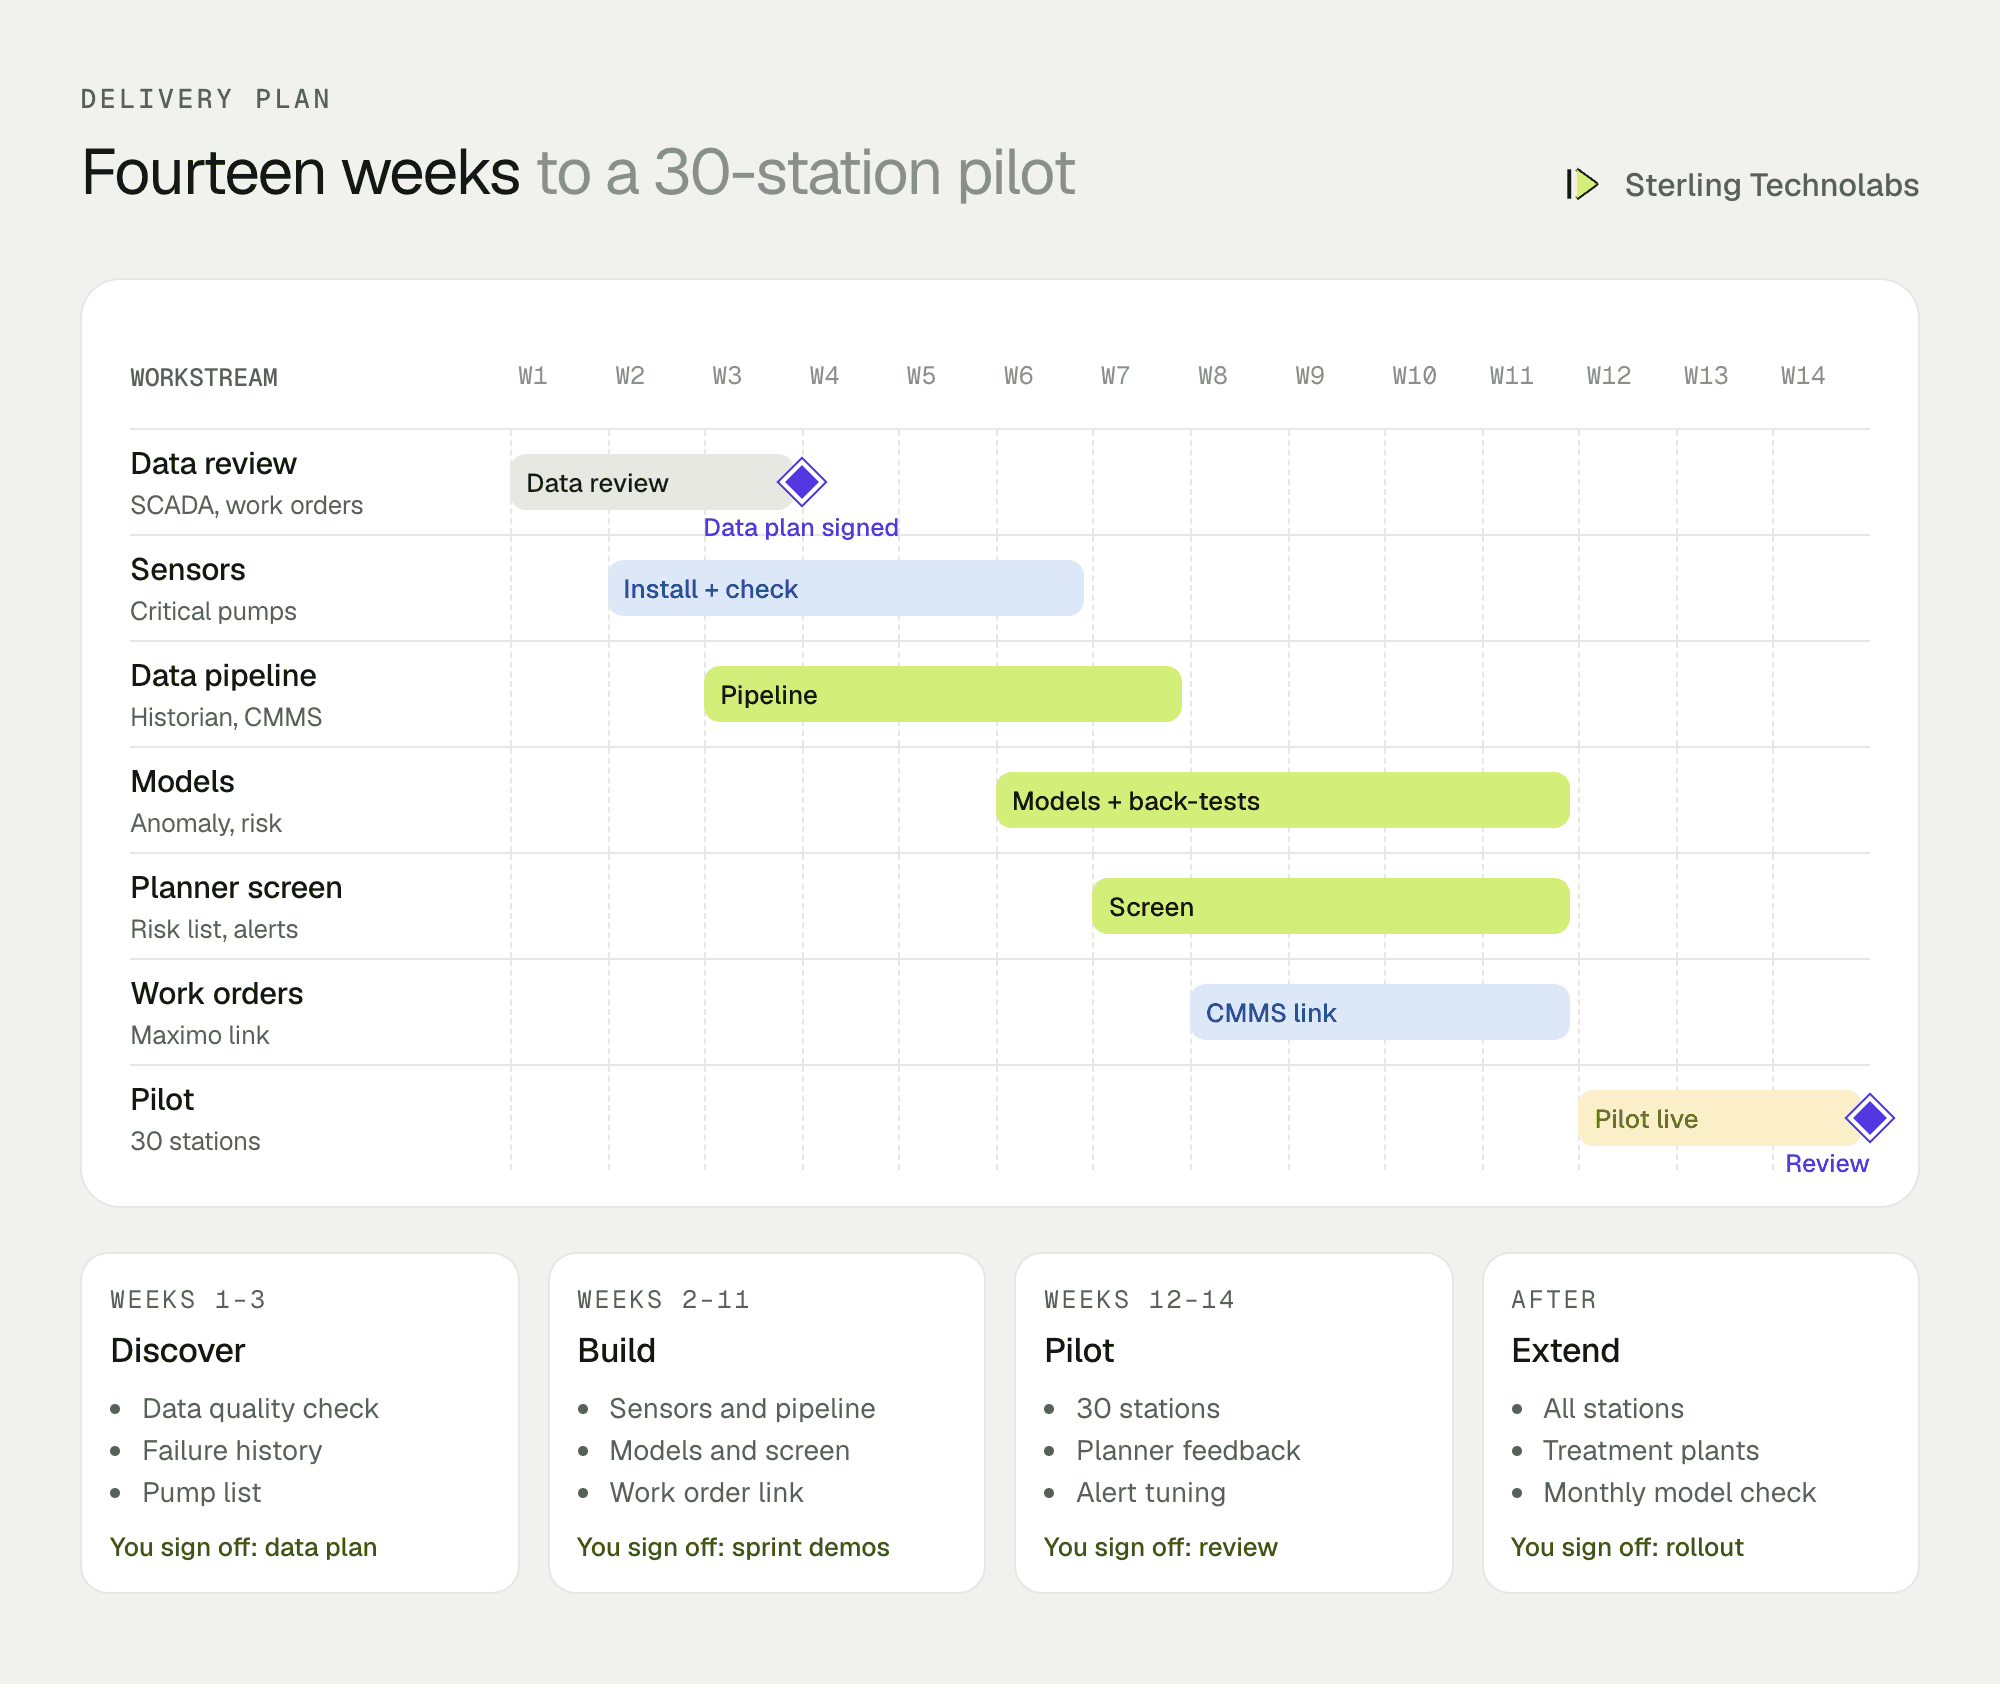
We'd pilot on 30 stations, including the ones with vibration sensors, while calendar maintenance continues everywhere. Once planners have worked with the alerts for a few weeks and the false-alarm rate is acceptable, the rest of the stations follow, then treatment plant equipment.
The team
| Role | Time | What they own |
|---|---|---|
| Solution architect | Part time | Architecture, SCADA and maintenance system links, security |
| Data engineer | Full time | Historian extraction, data quality, pipeline |
| Machine learning engineer | Full time | Models, back-tests against past failures, alert tuning |
| Full-stack developer | Weeks 6–14 | Planner screen and work order link |
| QA engineer | Weeks 9–14 | Data checks, alert tests, pilot support |
From your side: a maintenance planner, an operations supervisor, your SCADA engineer and your maintenance system administrator.
What changes the effort
- Data quality. Years of clean, well-named historian data shorten the work; missing tags and gaps add weeks.
- Failure history. Work orders with clear failure notes let us build risk models; vague notes mean starting with anomaly detection only.
- Sensors. The number of pumps that need new vibration sensors, and how easy it is to get data out of each station.
- Network and security. Getting data out of an operational network safely, usually through a one-way connection, takes planning with your OT team.
- Equipment types. Pumps first; blowers, mixers and treatment plant equipment add models.
Risks and how we'd handle them
| Risk | What we'd do |
|---|---|
| Too many false alarms | Alerts tuned during the pilot with planners, and a watch option before a work order. |
| Bad sensor data | Data checks on every reading, and sensor faults shown separately from pump problems. |
| Not enough failures to learn from | Anomaly detection first, with failure models only where history supports them. |
| Security of the control network | Read-only, one-way data flow out of SCADA, agreed with your OT and cyber teams. |
| Planners stop trusting it | Evidence on every alert, monthly accuracy reports, and calendar maintenance kept during the pilot. |
What we'd measure
| Metric | How we'd measure it | Baseline from |
|---|---|---|
| Emergency call-outs | Unplanned pump work orders per month | Maintenance system |
| Alert accuracy | Accepted alerts where crews found a real problem | Pilot findings |
| Warning time | Days between first alert and the repair | Pilot findings |
| Overtime hours | Maintenance overtime on pump work | Payroll reports |
| Overflow events | Reported overflows linked to pump failures | Regulatory reports |
Build or buy?
Several predictive maintenance software products and condition monitoring services exist, and for a plant with a few dozen standard machines they are often the quicker option. A custom build makes sense when your data sits across a SCADA historian and a maintenance system that the products don't connect to well, when you have hundreds of assets spread across sites, or when you want the models and data to stay yours. Many utilities use a vendor's sensors with a custom data pipeline and models.
Questions we'd ask on the first call
- How many pumps and stations, and which ones worry you most?
- Which SCADA historian and maintenance system do you use?
- How far back does your data go, and how complete are failure notes?
- Do any pumps already have vibration monitoring?
- How do data and people get in and out of the control network today?
FAQ
What is predictive maintenance software?
It watches equipment data, such as vibration, current, pressure and run hours, and flags machines that are starting to behave differently, so they can be repaired in a planned visit before they fail.
How is machine learning used in predictive maintenance?
Models learn each machine's normal behaviour from its history and flag changes. Where there are enough past failures, they also estimate which machines are most likely to fail soon.
Do we need new sensors?
Not to start. SCADA data covers many problems. Vibration sensors on the most critical pumps catch bearing and alignment faults earlier.
How long does it take to build predictive maintenance software?
A pilot on around 30 stations, with the data pipeline, models, planner screen and a maintenance system link, typically takes 12 to 14 weeks.
:: Typical stack
Python, machine learning models, SCADA historian (AVEVA PI or similar), wireless vibration sensors, Maximo or Cityworks API, React, Azure or AWS
:: Related service
Machine learning development
See the service

Send us your brief. We’ll help turn it into reality
A senior engineer replies within one business day with questions or a first plan: approach, team, timeline and estimate.
More blueprints like this


